Portfolio
One Data Hub, One Customer Journey, Room to Grow
What was the issue?
This local, 4-people nonprofit chamber of commerce runs on membership and event revenue: prospects come in through cold calls, referrals, events, and the website, and need to move cleanly through to a signed membership or paid event registration. As the organization grew, customer journey became broken and fragmented. Beyond a financial view, the leadership team had no consistent view of their daily activities and opportunities.
What was done?
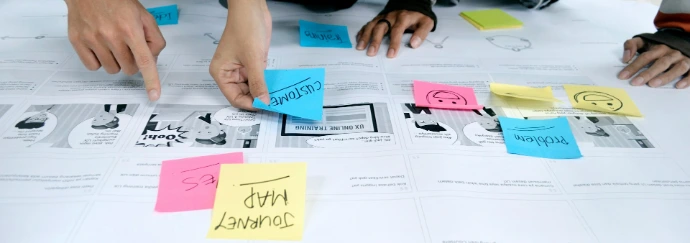
I mapped the end-to-end journey and rebuilt it around a single data hub (Odoo CRM ERP), with closed loops back to the website and the marketing automation tool, so a contact's record stays connected from first touch through to signed member.
What were the business outcomes?
Expected outcomes: a 10% increase in membership conversion from hot leads, and a 25% FTE shift from administrative capacity to business development.
Why Odoo?
Feedback from running this in production (Odoo v18): intuitive to adopt, a broad app ecosystem with no silos between modules, strong reconciliation and spreadsheet-style reporting, and it's used globally across multiple countries and markets — which mattered for a chamber of commerce with a cross-border membership base.
From Scattered Status to One Source of Truth: A Data-Driven & AI-Enabled Program Management Cockpit

What was the issue?
Large, multi-workstream programs (5–10 systems, 3–5 parallel workstreams, cross-functional teams) generate status information in too many disconnected places at once: Jira or Azure DevOps for engineering progress, Excel and Google Sheets for tracking, Slack, email, and Notion for the conversations that actually explain why something changed.
Program leadership ends up assembling a picture manually, workstream by workstream, tool by tool — usually the day before a steering committee. By the time it's compiled, it's already stale, and every team has spent time reformatting the same numbers into a different template for a different audience.
What was done?
I built a lightweight three-layer cockpit architecture to test whether this could be automated without forcing teams to change how they already work:
1. Source Layer — captures data directly from where teams already operate: Jira/Azure DevOps, Excel/Google Sheets, Email/Slack/Notion. No new tools imposed on delivery teams.
2. Ingestion & Intelligence Layer — a Python ETL pipeline (built on a reusable model from prior program experience) pulls, cleans, and reconciles that data. Zapier (or n8n) handles automation triggers between steps, and a Claude-powered layer is piloted for business-logic rule triggers on top of the structured data — for example, flagging status changes that fit known risk patterns.
3. Rendering & Decision Layer — the structured, computed data (KPIs included) flows into Power BI dashboards for governance-level reporting and Notion for shared, always-current program views, with automated stakeholder alerts for accessibility across audiences.
This was built and tested as a working prototype using sample/simulated program data — it demonstrates the pipeline end to end, not a production deployment against live client systems.
What were the intended business outcomes?
The prototype is designed to move a program from manual, backward-looking status compilation to a shared, decision-ready view that updates continuously. In principle, this means:
- Less time spent by PMs and workstream leads reformatting the same status into different templates for different audiences
- A single point of truth that leadership, teams, and governance can all reference, rather than reconciling conflicting versions
- Earlier visibility into risk, since business-logic triggers can flag patterns as data arrives rather than waiting for a status meeting
Why this stack?
- Python — for the ETL layer. It's the right tool for cleaning, reconciling, and standardizing messy, multi-source project data locally, and the model is reusable across programs rather than built from scratch each time. It also has a rich ecosystem of libraries for data analysis and prediction.
- Claude — piloted for the intelligence layer, applying business logic and pattern recognition on top of structured data in a way that's faster to iterate on than hand-coded rule sets, while staying auditable.
- Power BI (or any other data dashboarding tool) — the layer governance and leadership already trust for dashboard reporting, so the output plugs into an existing decision-making habit instead of asking for a new one.
- Notion (or any other knowledge management tool) — as a single repository for the synthesized output, shared across all stakeholders.
- Zapier (or n8n) — for additional workflow automations, like human loop escalation checkpoint, integration with other tools.
The combination keeps the "zero disruption" principle from the source layer intact: teams keep their existing tools, and the automation does the reconciling work behind the scenes.